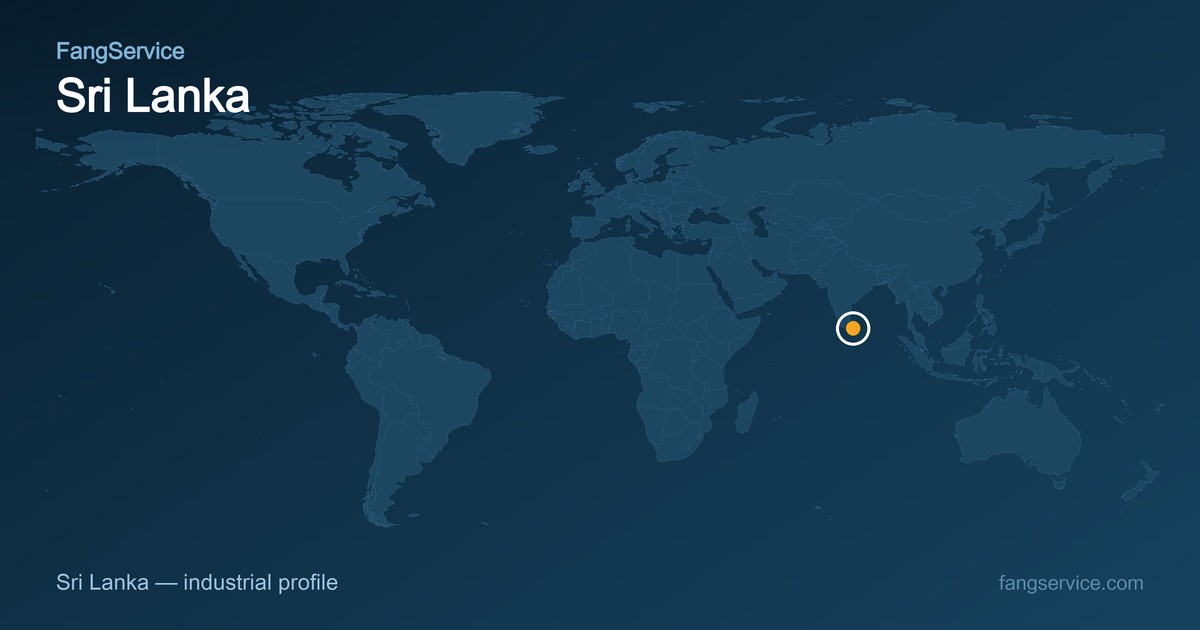
Industrial Overview
- World Rank by Industrial Output
- #74
- Industrial Value Added
- 277USD 100M
- of which Manufacturing
- 186USD 100M
- Land Area
- 6.610,000 km²
- Population
- 2,17610,000 people
- Official Language
- Sinhala, Tamil
Key Industrial Sectors
Tea
Ceylon tea is grown on estates across the central highlands around Kandy, Nuwara Eliya, Badulla and Ratnapura, and is the country's leading agricultural export; black tea is shipped to Iraq, Russia, Turkey and the Gulf, and the Colombo auction sets regional prices.
Apparel and textiles
Garment factories in the Katunayake and Biyagama export processing zones near Colombo and in Kandy cut and sew lingerie, sportswear and knitwear for European and US brands; apparel is the island's largest export earner and biggest formal employer.
Rubber and rubber products
Rubber is grown in the wet zone around Kalutara, Ratnapura and Kegalle and processed into tires, gloves, industrial and surgical products; solid tires and latex articles are exported to Europe, the United States and India, making rubber a steady industrial earner.
Cement and construction materials
Cement plants at Puttalam and Kankesanthurai supply housing, roads, ports and the Colombo port city project; steel, glass and roofing are tied to the same construction cycle, and the sector depends heavily on imported clinker and coal.
Food, beverages and coconut
Coconut products, spices, confectionery, beverages and processed food are made around Colombo, Kurunegala and the coconut triangle; desiccated coconut, cinnamon and pepper are exported worldwide, while breweries and soft-drink bottlers serve the domestic market and regional buyers.
National Export Live Dashboard External
Aggregating official trade, industrial, FX, logistics and policy signals. Sample data; linked to authoritative sources and updated.
- Industrial value added (2025)
- 277 USD 100M
- of which manufacturing (2025)
- 186 USD 100M
- Global industrial output rank
- #74
- Land area
- 6.6 10,000 km²
- Population
- 2,176 10,000 people
- Key industrial sectors
- Tea, Apparel and textiles, Rubber and rubber products, Cement and construction materials, Food, beverages and coconut
- Top trade partners
- —
- FTAs signed
- —
- Key exchange rate
- —
- Latest policy / tariff changes
- —
- Ports / logistics status
- —
+ Subscribe to official data updates External
Target Market Opportunities Partner External
Organized by export journey and personalized recommendations; filter by industry / target market. Scores and import data are samples, linked to official import statistics and platforms.
🇺🇸 United States
🇪🇺 European Union
🌏 ASEAN
🇦🇪 Middle East
Buyer profiles · channel maps · FTA benefits & rules of origin · competitive landscape — External: Access2Markets · OEC
Four Core Service Paths
Each path is tagged: In-house (FangService delivers) · Partner (referred/joint) · External (official/3rd-party).
Compliance & Market Access
HS codes, tariffs, certification, origin, tax templates
- HS code / tariff calculator (WTO Tariff Database)External
- Export control / sanctions screeningExternal
- Target-market certification (CE/FDA/ISO…) translation & agencyIn-housePartner
- Compliance templates (invoice/packing/COO)In-house
- VAT/GST/refund policy lookupExternal
Logistics & Customs
Ports/rail/air, freight rates & transit, forwarder directory
- Sailing schedules / freight / freight indexExternal
- Customs clearance docs & process guidanceIn-house
- Local forwarders / brokers / insurance directoryPartner
- Warehousing / cold-chain / returnsPartner
- China-Europe rail / multimodal trackingExternal
Finance / Payments / Tax
Cross-border payment, insurance, FX hedge, rebates
- Cross-border collection / L/C / factoringPartner
- Export credit insurance / rebate guideExternal
- FX hedging / settlementExternal
- Tariff+logistics+tax total cost estimatorExternal
Marketing & Acquisition
Ads, SEO, localized content, buyer directories
- Overseas prospect directoryIn-house
- Google/LinkedIn/TikTok campaignsPartner
- Localized copy / software UI localizationIn-house
- Trade shows / B2B matchmaking / KOLPartner
- Distributor recruitment & global expo calendarExternal
Tools & Data External
Basic version is login-free; save results and generate reports after login. Tariff/HS/ROI/import data/API link to official or third-party authoritative sources.
Tariff calculator External
Enter HS + target country for estimated tariff
HS code lookup External
Search HS directory & classification
Compliance checklist In-house
Generate go-global compliance checklist by country
Market entry scorer External
Multi-dimensional market data & scoring
ROI / cost estimator External
Tariff + tax total cost
Export document generator In-house
Invoice/packing/COO template download
Target-country import data External
Import statistics & structure by country
Expo calendar External
Global industry trade-show schedule
API / data subscription External
Official data publishing interface
Content, Learning & Community Partner External
Local peer cases
Sample · to be confirmed
Client testimonials
Sample · to be confirmed
Recommended by Go-Global Stage
Take your products global
Tell us your target market and industry; FangService builds a customized go-global plan.
Free diagnosis / Book a consult →Explore FangService
FAQ
What are the most important industrial sectors in Sri Lanka?
The most important industrial sectors in Sri Lanka are: Tea, Apparel and textiles, Rubber and rubber products, Cement and construction materials, Food, beverages and coconut.
What are the main opportunities for businesses in Sri Lanka?
Sri Lanka's industry centers on Tea, Apparel and textiles, Rubber and rubber products, Cement and construction materials, Food, beverages and coconut; local businesses can build on these strengths to capture domestic and regional demand.
Where does this data come from and how often is it updated?
Data comes from the World Bank World Development Indicators, 2025 vintage (updated ), refreshed annually.
What are the main challenges facing Sri Lanka's industrial sector?
Like many economies, Sri Lanka aims to deepen manufacturing value-add and regional integration; specifics vary by sector.
Source: World Bank World Development Indicators (2025 vintage, updated ). Industrial value added = mining + manufacturing + electricity/gas/water + construction, in current USD. Last updated:2026-10-14